|

|
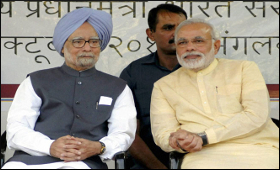
Modi & Manmohan: 1 Year, spot the differences
|
|
|
|
| Top Stories |
 |
|
|
|
SME Times News Bureau | 11 May, 2015
The economy rebounded; exports and imports declined, foreign-exchange reserves grew; coal production, electricity generation and petroleum consumption rose, non-performing assets (NPAs) in banking soared.
There are great similarities between Prime Minister Narendra Modi's first year in office - which he completes on May 26 - and the corresponding first year of his predecessor, Manmohan Singh's last term.
In seven of 12 indicators evaluated by IndiaSpend, the data reveal a similar trend - a reasonable economic performance after an economic downturn.
The large variations in the first-year period centre on:
Industrial production: In Modi's first year, the index of industrial production (IIP) for eight core sectors (coal, crude oil, natural gas, refinery products, fertilisers, steel, cement and electricity) grew 5 percent during 2014-15 against 4.2 percent the previous year. In Singh's first year, the IIP for six core industries (crude oil, refinery products, coal, electricity, cement and finished carbon steel) grew 10.4 percent, compared to 2.8 percent in the previous year 2008-09.
Exports and imports: In terms of dollars, exports and imports declined 2 percent and 0.5 percent, respectively, in 2014-15 from 2013-14. In Singh's first year (of his second term) exports and imports declined far more sharply, 4 percent and 5 percent, respectively, in 2009-10 compared to 2008-09.
Nuclear energy: With the commissioning of the Kudankulam Unit-1 of 1,000 mw in Tamil Nadu during December 2014, India's installed nuclear capacity reached 5,780 mw in 2014-15 from 4,780 MW in 2013-14, an increase of 21 perccent. In 2009-10, it was up 10.6 percent from the previous year.
Direct comparisons are difficult, considering that Singh was in his second term in office. Modi carries Singh's economic legacy, which worsened considerably by the end of the term, attributed by observers to a global downturn and misgovernance.
But these indicators offer a broad statistical evaluation of the first years of Modi and Singh during UPA2.
A journey through the numbers
Economic Growth: Overall gross domestic product (GDP) growth in 2009-10, at constant prices, was reported to be 8.9 percent. After a change in calculation and base year, GDP growth isestimated to be 7.4 percent for 2014-15.
Agriculture: Agriculture, which employs about 600 million Indians, registered growth of 1.1 percent in 2014-15 compared to 0.8 percent during 2009-10. The numbers indicate a long-standing - and worsening - crisis.
Foreign-exchange reserves: Forex reserves increased 12 percent from USD341 billion at the end of 2014-15 as compared to USD304 billion at the end of 2013-14. For Singh in UPA2, they increased 5.4 percent from USD241.7 billion at the end of 2008-09 to USD254.9 billion in 2009-10.
Coal: Coal from India's mines increased 8.2 percent in 2014-15, later falling into a controversy over botched allotments, one of the reasons for the decline in UPA2's image. In 2009-10, production increased 8.1 percent. Performance of the coal sector is expected to improve with the re-allotment of 67 coal blocks through an auction, although Modi's figure of Rs.2 lakh crore (USD31.25 billion) windfall is now contested.
Petroleum: In 2014-15, consumption of petroleum products (diesel, petrol, LPG and the like) increased 3.1 percent, compared to 3.2 percent during 2009-10. India's demand for petroleum products is expected to grow 3.3 percent in the next financial year, according to the oil ministry.
Electricity: A good indicator of an economy's health, installed electricity capacity in 2014-15, rose 10 percentagainst 2013-14. In 2009-10, it increased 7.7 percent over the previous year.
Renewable energy: With pressure on India to cut carbon emissions renewable energy - it is responsible for 12 percent of India's total installed power - growth rates were high during both terms. The total installed capacity of renewable energy reported a 7.56 percent growth in 2014-15 and growth of 17.20 percent in 2009-10.
Non-performing assets: NPAs of public sector banks increased 17 percent from Rs.2.27 lakh crore in March 2014 to Rs.2.73 lakh crore in December 2014, a carry-over from UPA2. Public sector bank NPAs had increased 23 percent in 2009-10 over the previous year. NPA growth rates of this magnitude can destabilise the banking system.
(In arrangement with IndiaSpend.org, a data-driven, non-profit, public-interest journalism platform)
|
|
|
| |
|
|
|
|
|
|
|
|
|
|
|
|
|
|
| |
| Customs Exchange Rates |
| Currency |
Import |
Export |
US Dollar
|
66.20
|
64.50 |
UK Pound
|
87.50
|
84.65 |
Euro
|
78.25
|
75.65 |
| Japanese
Yen |
58.85 |
56.85 |
| As on 13 Aug, 2022 |
|
|
| Daily Poll |
 |
 |
| PM Modi's recent US visit to redefine India-US bilateral relations |
|
|
|
|
|
| Commented Stories |
|
|
|
|
|
|
| |
|